
Chris
Amazon Ad Specialist
- 7 min read
5 Metrics to Unlock Amazon Seller Account Value
Navigating the complexities of selling on Amazon can be challenging; especially when trying to optimize performance metrics to achieve your goals.
Why Metrics and Statistics Matter
It can be hard to decide where to look, and which values to compare to other data. It’s not always clear how to analyze what is happening with a specific product, product line, or your entire account. Too, it can be daunting to fully prepare and implement changes to achieve the best possible results.
Certain categories are highly competitive, but you can still be successful if you know what to look at, how to analyze things, and which relevant levers to pull to better align your performance with your goals.
Am I Looking at the Right Stuff?
Sales and ACoS (Advertising Cost of Sales) are probably the most commonly used data points that even those new to the game will recognize. No wonder so much literature has been written around the idea of controlling your cost and thus protecting your profits. Endless hours of YouTube videos discuss the same and there are even free or paid-for courses that revolve around these topics.
It takes some experience for one to rise above it all and start asking themselves “Do I really know my metrics? Am I looking at what truly matters?”
One of the first realizations is usually the understanding that TACoS (Total Advertising Cost of Sales) might be a more important datapoint than ACoS. The latter being entirely rooted in our advertising metrics, tends to ignore any potential results (good or bad) on the non-advertising or so-called organic side of things.
For example, an ACoS-focused approach might tell you nothing more than to keep your percentage at or below break-even so that you never lose money (that could occur by basically paying more for ads than you make in sales through those ads).
However, a fairly superficial review can easily uncover the unstable nature of this viewpoint, by shedding light to the fact that no matter how “bad” your ACoS might look, if it results in a high enough volume of organic sales, you can still make a healthy profit. Therefore, the ad-oriented ACoS may become less important for you than the total-sales-focused TACoS (that is the percentage value of your ad spend $ compared to the total sales $).
The Problem of Missing Metrics
Campaign Manager has been giving us more and more data over the years, new ad types, targeting types, then even newer metrics. Yet certain numbers just never seem to make it in there.
TACoS (Total Advertising Cost of Sales)
Dividing your Ad Spend by your Total Sales (revenue) you get your Advertising Cost of Sales. A fairly simple calculation however you do not get this metric from Amazon directly. Try looking at it for your entire account or for a listing with all it’s variations and you will begin to see how useful keeping an eye on TACoS at different level can be for you.
The more additional statistics you compare TACoS to, the more beneficial the review becomes. Compare your TACoS for a single campaign’s Mon-Sun performance if you want, laying it over the previous Mon-Sun period and once you see what direction it has been shifting to, see how that potentially influenced your Sales or Organic Sales and how it relates to any changes in your ACoS for the same period.
Gross Profit Percentage
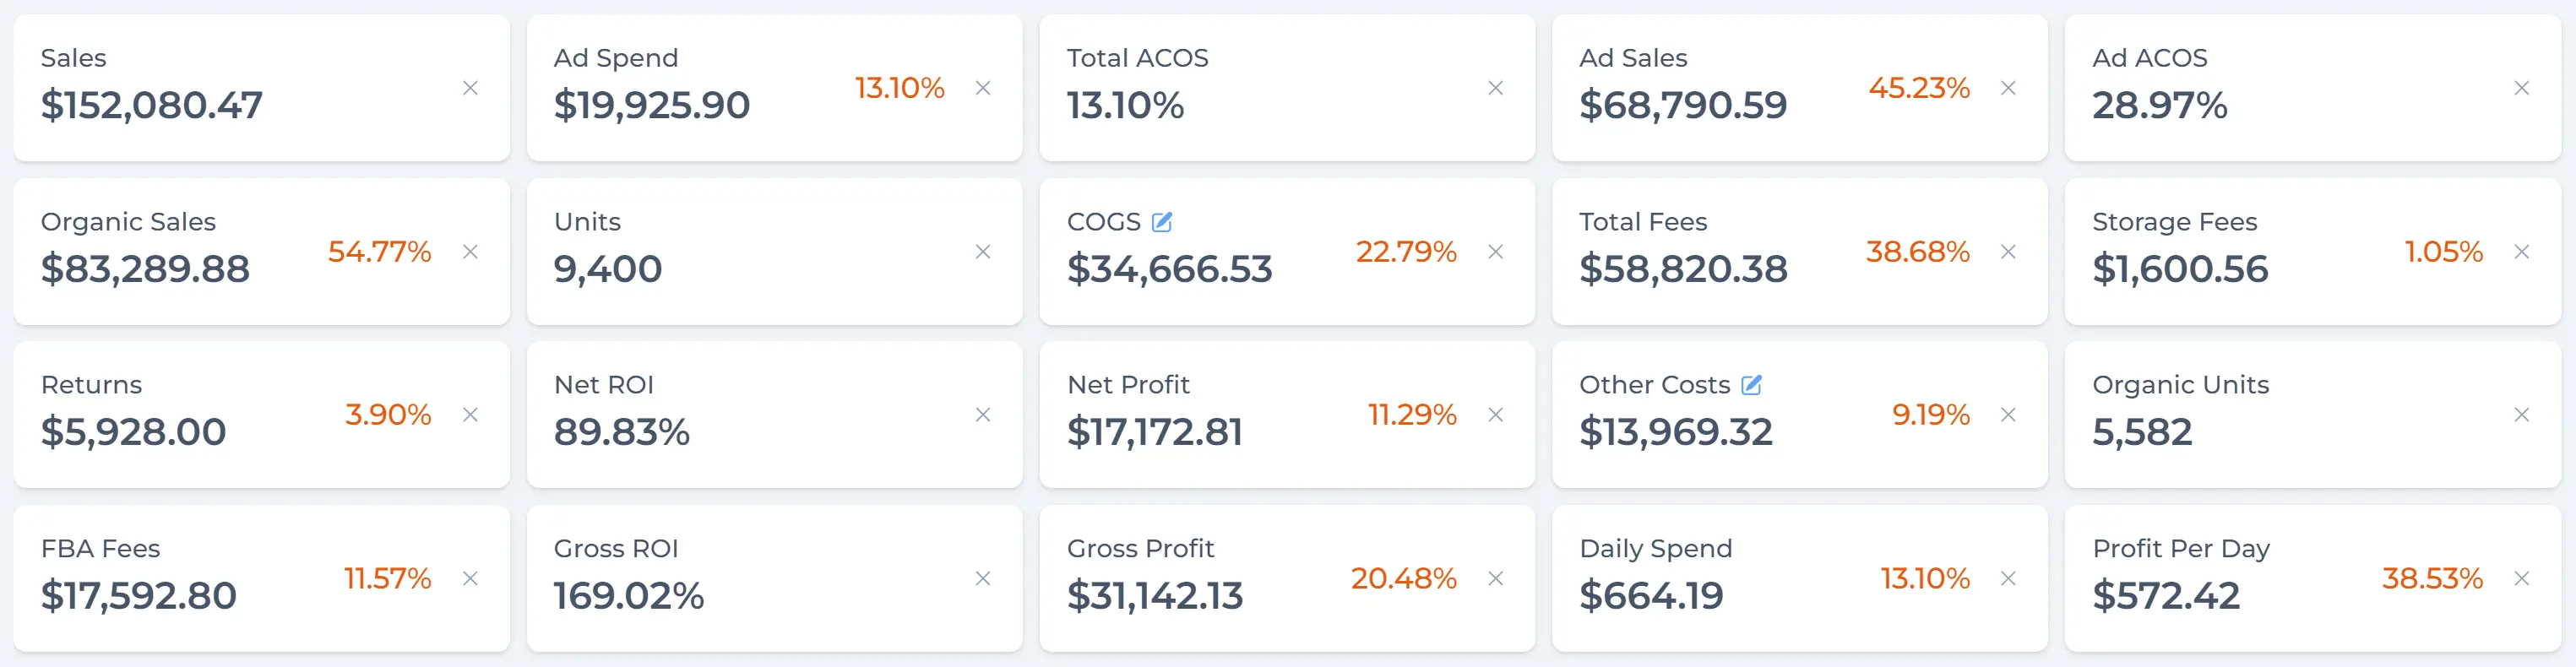
Although Amazon doesn’t take your CoGS (Cost of Goods Sold) into account, and they don’t provide you with reports that fully account for your costs, every Amazon seller quickly learns that their bottom line, gross profit and ultimately net profit are all too important to neglect just because they aren’t compiled and readily provided by Amazon like so many other metrics are. That is why when we built our dashboard, we combined both Amazon reports and fields for CoGS where the user can report such figures for each product.
Because CoGS include your product cost as well as shipping cost to Amazon (and from Amazon in case of FBM), only with CoGS in mind can you calculate the potential Profit Margins, pinpoint sore spots on the account that need attention, while also highlighting child or parent ASINs that are doing well and where you could increase your profits even further.
Take the revenue that comes in on a product, deduct your CoGS and also deduct the Amazon fees. What you are left with is your Potential Gross Profit Dollar Value. If you wish to see it expressed in percentages then divide this number by the original revenue figure, times 100. This % is basically the maximum potential profit % that applies to that product.
Net Profit
Once the product has been manufactured and shipped to Amazon and you finally are reviewing the POTENTIAL profits you could make, unfortunately additional costs will creep in that you must take into account. Storage fees will be assessed based on how quickly your inventory sells, and you might see Returns too that will chip away at your profits. Another factor that you will have more control over is Advertising Spend. Any $ you spend on Amazon ads will come out of your Gross Profit number.
Once all of the above is deducted you will be left with what we could call your Net Profit, at least from your Amazon Store perspective. Of course if you rent office space, have a payroll etc. then the Net Profit we just calculated would only be an interim number to think with, at the same time those other types of cost tend to be close the same month to month hence this calculation will still get you where you need to be at.
CVR (Conversion Rate)
The relationship between Impressions and Clicks has been covered by CTR (Click-through rate), much like CPC (Cost-per-click) covers the relationship between Ad Spend and the number of clicks you receive.
However, Conversion Rate or CVR is not easily accessible. Even though this would show you how the number of clicks you pay for, compares to the Orders you receive. CVR can easily be more important to you in many cases than CTR or CPC.
Take the campaign level, or ASIN level etc. data you are looking at depending on what you are interested to review. Orders divided by Clicks times 100 will give you the percentage of the Clicks (visits through ads) that actually resulted in sales for you.
Organic Sales Percentage
When you take your Total Sales and deduct your Ad Sales figure from it, you are left with the organic or non-advertised portion of your revenue in dollar value. Also referred to as Organic Sales. Following the same logic mentioned earlier you can turn any number into a percentage value easily, in this case:
In profit focused calculations the dollar value based metrics will make more sense. You of course want to see your Organic Sales Percentage increase while keeping an eye on overall sales figures too since no matter how good a higher organic percentage might look, if that is associated with a smaller pie of total sales, this still could mean profits are hurting more than before.
Others prefer to think with Organic Unit Sales Percentage, comparing the total units sold against the number of units sold through ads. As long as the difference between Orders and Units are clear, both approach have a place. The first one as mentioned probably work better for a profit focused approach while the latter, unit-focused approach can be beneficial while handling one’s BSR for example.
Conclusion
Selling on Amazon can be a challenge, but with the right strategies and tools, you can ensure that it becomes or remains a profitable business for you. Online sales in general have been growing year after year, and Amazon has been the biggest player in the field. Even at its current enormous size, accounting for more than half of the entire online market in 2022, Amazon continues to grow. It's unlikely that you've missed the boat or that it's too late to jump in.
We constantly hear of sellers who failed years ago but learned from the experience and are thriving in the new environment. Or those who have never stopped learning new skills and adjusting their business to new trends, so they continue to thrive no matter what.
Whichever group you fall into, by focusing on the right metrics, leveraging the power of experience, and using tools like the Samurai Seller Dashboard [link], you can unlock the hidden value of your account and achieve greater success!